Traditional Cell Site Maps
Cell sites serve as powerful tools in law enforcement investigations. They provide timelines and maps of critical events, putting phones near or far from crime scenes. Cell sites can condemn suspects or exonerate them. Additionally, cell sites serve as non-partisan witnesses. However, cell sites aren’t a magic bullet to solving cases. While the maps can look very precise, the locations plotted are just towers. The actual phone could be in a range of places.
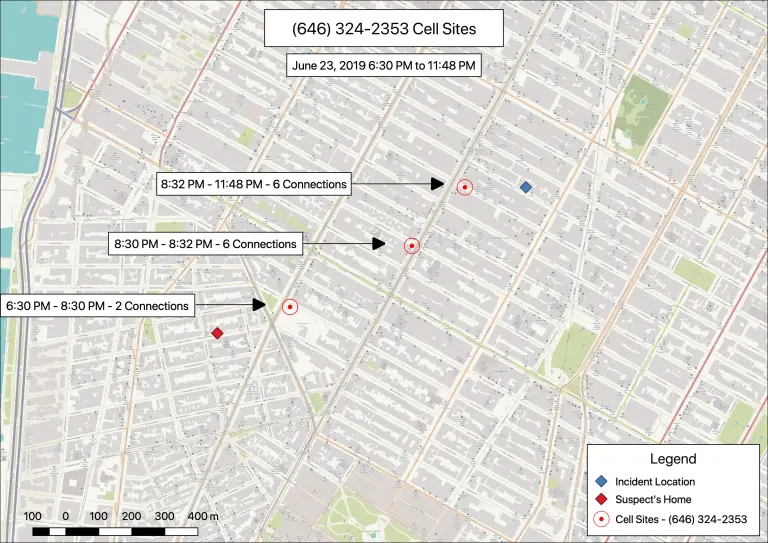
In the simulated example above, you can see the suspect’s home plotted as the red diamond. The various red circles are connections that his phone made to towers. The direction of the movement would suggest he is traveling towards the incident location. The final connection is at 11:48 PM. For a shooting that happened at 11:40 PM, this would put him in the general area.
Heat Maps For Pattern of Life Analysis
Heat maps are useful when you want to display a person’s life habits over a long period of time. While cell sites show really specific points in time, heat maps can show a person’s behavior over months or years. If you had a traditional cell site map, you’d have hundreds of boxes showing the specific times the phone made calls. Heat maps greatly simplify the view.
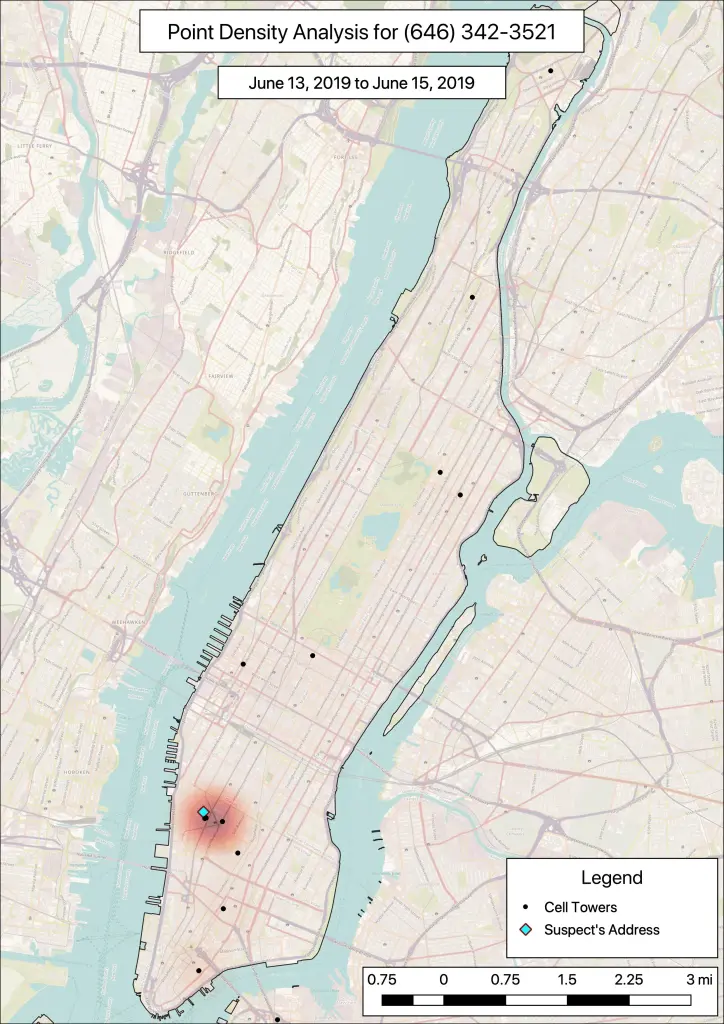
In this example, you can see a phone’s behavior around the borough of Manhattan over a few days. The black dots are the cell towers the phone connected to from June 13th to June 15th. The “hot” area of the map shows that the density of connections is much heaver near his apartment. That makes sense, as people spend a lot of time at their home. Therefore, they’re more likely to use their phone there.
Radii Maps for a More Precise Analysis Analysis
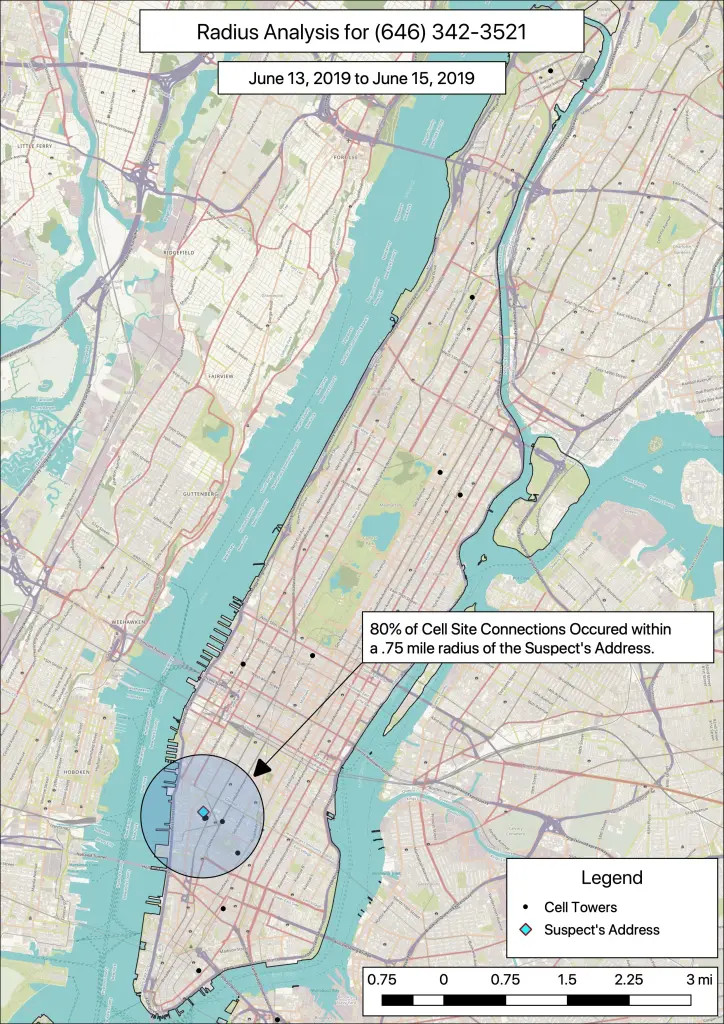
Heat maps provide a colorful and dynamic exhibit to show patterns. However, if you’re looking for a more specific analysis, radii maps work great. They identify a point and highlight the number of connections a set distance away from that point. This shows similar habits with more specificity.
In the real world, these maps are great evidence to prove people’s relationships with spaces. For example, I worked on a case where we needed to prove that two people were in a relationship. The map looked pretty similar, except we saw another concentration near his girlfriend’s address.
For example, here’s a radius analysis using the same map extent as before. Instead of that heat map, there’s a circle drawn around the suspect’s address with a radius of .75 miles. Turns out 80% of the cell site connections from June 13, 2019 through June 15, 2019 occur within this radius. That means the phone hung out near his apartment the vast majority of the time. These are pretty typical results of someone staying home.